WebNetVis
A Tool for Network Visualization
The steps to generate a graph are as follows:
Prepare Data
Prepare a csv file containing the information of nodes. See example
Prepare a csv file containng the information of edges. See example
Visualize Network
Upload the files containing inforamtion of nodes and edges.
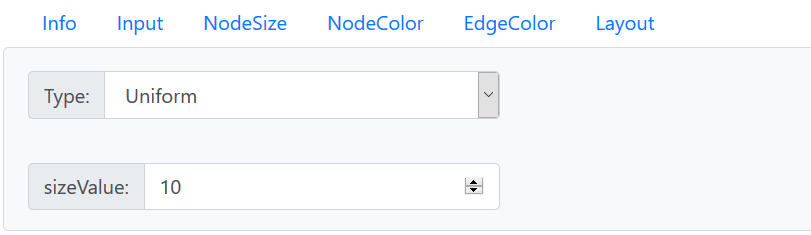
Adjust the size of the nodes in the graph.
Adjust the color of the nodes in the graph.
Adjust the color of the edges in the graph.
Adjust the positions of the nodes in the graph.
Output
Download the graph as a pdf file and save it.
View the information of all nodes.
Download a csv file containing the information of all nodes calculated by the program.
Adjust the width of edges in the graph.
Adjust the size of arrows in the graph and decide whether to show the arrows.
Adjust the size of nodes in the graph.
Adjust the color of labels in the graph and decide whether to show the labels.
Choose the edges in the graph to be whether curve or straight.
Click on one of the nodes and the information of the node will be shown on the right side.
© Lab for Big Data Methodology
Department of Psychology, University of Notre Dame
Supported by IES and Notre Dame Global